


Brain Maps
|
|
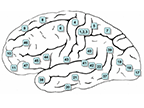
Interactive Brain - To explore parts of the brain, click on the different regions or use the provided menu buttons (Created by Gary Homidas)
|
|
BrainVisor Tutorial on Brain Structure and Function
|
|
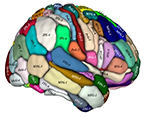
The Brodmann’s map is one of the most commonly used cytoarchitetonic maps used to map the functional organization, structure, and distribution of cortical cells. |
|
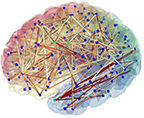
Novel methodologies and computerized brain mapping techniques will be developed to study the structure, function, and spatio-temporal changes in the human brain as well as the brains of non-human primates. The brainnetome atlas will be an in vivo map, with more fine-grained functional brain subregions and detailed anatomical and functional connection patterns for each area, which could help researchers to more accurately describe the locations of the activation or connectivity in the brain. |
|
The Human Connectome Project: How the brain’s wiring makes us who we are. The Human Connectome Project: creating a complete roadmap of the brain - video |
|
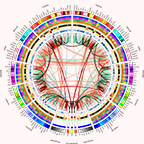
Connectograms are graphical representations of connectomics (see the human connectome project), the field of study dedicated to mapping and interpreting all of the white matter fiber connections in the human brain. These circular graphs based on Diffusion MRI data utilize graph theory to demonstrate the white matter connections and cortical characteristics for single structures, single subjects, or populations. Andrei Irimia, Micah C. Chambers, Carinna M. Torgerson, John D. Van Horn
Andrei Irimia, Ph.D. |
BrainVisor – Protect Your BrainBrainVisor does not provide medical or psychological advice, diagnosis or treatment recommendations. The material on this site is for informational purposes only and is not a substitute for your doctor or other health care professional's care.
|
 |
|||
|